

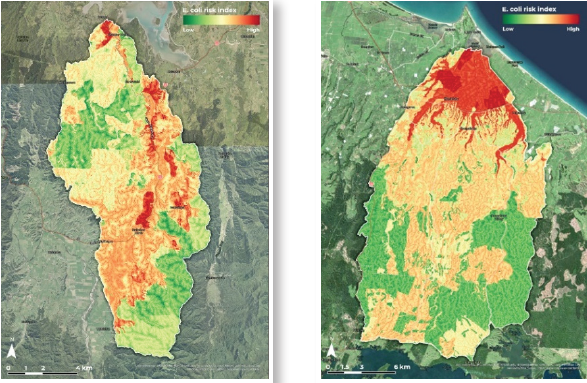
Biophysical Risk Map – E. coli
E. coli risk processes
Escherichia coli (E. coli) is a bacterium that is contained in the intestines of people and animals. Measurements of E. coli in water bodies indicates that animal excreta has entered the waterway. Faecal coliforms in waterways pose a human health risk. Drinking or swimming in waterways containing high levels of E. coli can cause mild to severe gastrointestinal illness.
The main source of E. coli entering waterways is from animals directly depositing dung (excreta), or through surface runoff of animal excreta into waterways during rainfall events.
Data layers used to develop the risk maps
Data layers used in the risk map, what they represent and their weightings. The weighting assigned is based on the layers’ impact on the overall E. coli loss risk.
| Input Layer | Reasoning | Weighting |
| Catchment sensitivity – E-coli |
The sensitivity to the receiving environment to E. coli. This was provided by the Regional Council. | 31% |
| LUCAS land use 2020 | Land use cover. This is based on data collected in 2020. Each land cover layer is assigned a risk factor. Areas covered in trees are assigned a lower risk than open pastures. The 2020 Land Use Map has a nominal mapping date of 31 December 2020, however, mapping is based on satellite imagery captured over a range of dates over the 2020/21 summer period. Note: If land use change has occurred more recently, this will not be picked up in the risk map. |
24% |
| Annual accumulated rainfall (mm) | Total average rainfall based on long term data for the catchment. Higher rainfalls increase the E. coli runoff risk. | 4% |
| S-map soil drainage / FSL Permeability | The effect of soil type on E. coli risk. Heavier, poorer draining soils have higher risk than free draining soils. Note: If present, S-map data is used. Otherwise, the fundamental soil layer (FSL) is used. FSL data layer is coarser than S-maps. |
15% |
| Proximity to waterways (Overland flow pathway) | Represents the distance to a waterway. Risk of E-coli is increased either through stock entering waterways and depositing excreta directly into waterways or runoff is increased the closer the waterway. | 16% |
| Geomorphon landforms | Used to represent the likelihood that this landform would contribute E. coli to waterways. Valley floors and flat areas are more likely to contribute E. coli than ridges and peaks as animals are less likely to congregate. | 10% |
How to interpret
The example E. coli risk map for a farm is shown below. It identifies the following risk areas:
- Very high-risk areas in and around waterways
- Risk decreases as distance from a waterway increases
- Low risk on vegetated blocks.
Some of these risk areas may have already been mitigated or managed to reduce E. coli loss risk, such as stock exclusion, fencing and riparian planting. Alternatively, the landowner could use this map to identify or prioritise areas for mitigation options.
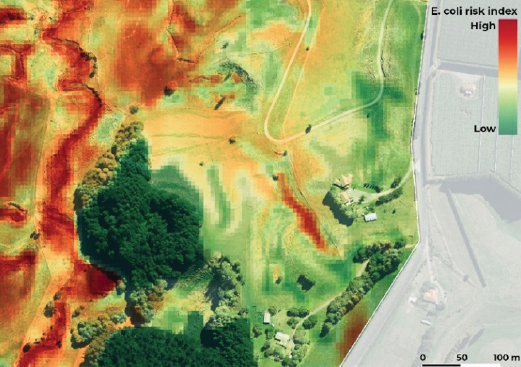
Example risk map for E. coli.