

Biophysical Risk Map – Nitrogen
Nitrogen risk processes
Nitrogen’s main loss process is through movement of nitrogen (N) through the soil out of the root zone during drainage events (rainfall or irrigation).
There are two main factors that drive nitrogen leaching risk: Soil drainage and rainfall. The freer draining a soil is, the greater the leaching potential. Overlay soil drainage with high rainfall (or irrigation) then the potential for nitrogen loss is increased.
Data layers used to develop the nitrogen risk maps
Data layers used in the risk map, what they represent and their weightings. The weighting assigned is based on the layers’ impact on the overall nitrogen loss risk.
| Input layer | Represents | Weighting |
| Catchment sensitivity – N leaching | The sensitivity to the receiving environment to nitrogen. This was provided by the Regional Council. | 31% |
| S-map N leaching Risk OR FSL soil drainage |
The effect of soil type on nitrogen loss. Lighter more free draining soils have higher risk than heavier clay soils. Note: If present, S-map data is used. Otherwise, the fundamental soil layer (FSL) is used. FSL data layer is coarser than S-maps. |
34% |
| LUCAS 2020 | Land use cover. This is based on data collected in 2020. Each land cover layer is assigned a risk factor. Areas covered in trees are assigned a lower risk than open pastures. Note: If land use change has occurred more recently, this will not be picked up in the risk map. |
19% |
| Slope | Used to identify which parts of the farm will accumulate nitrogen making it more susceptible to leaching during a rainfall event. | 10% |
| Annual accumulated rainfall (mm) | Total average rainfall based on long term data for the catchment. Higher rainfalls increase the nitrogen leaching risk. | 5% |
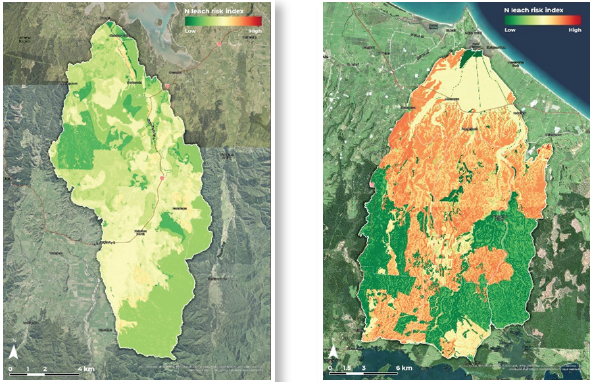
How to interpret
An example nitrogen leaching risk map for a farm is shown below. It identifies the following risk areas:
- High N loss risk from free draining soils on the flat
- Lower N loss risk from vegetated areas on the slope.
Some of these risk areas may have already been mitigated or managed to reduce N loss risk, such as winter grazing management or catch crops. Alternatively, the landowner could use this map to identify or prioritise areas for mitigation options, or appropriate areas to spread dairy shed effluent.
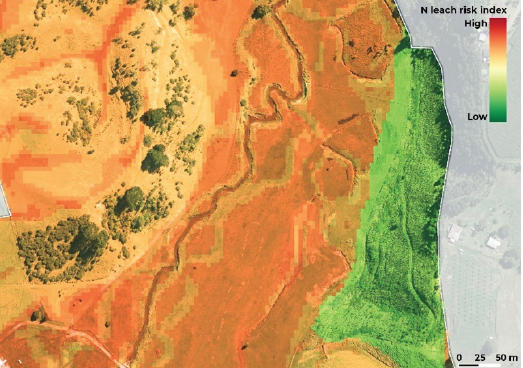
Example risk map for nitrogen.