

Biophysical Risk Map – Phosphorus
Phosphorus risk processes
The main loss process for phosphorus (P) is runoff or overland flow. Runoff is when water (and contaminants carried in it) move over the surface of the land. Runoff is more common on steeper land, poor draining soils or when the soil is exposed due to lack of cover.
Phosphorus runoff is also increased when the soil P content is higher. Soil P can be naturally occurring or be increased through the addition of fertilisers and/or animal excreta.
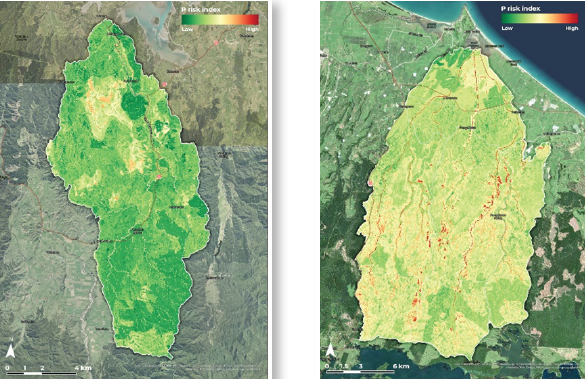
Data layers used to develop the P risk maps
Data layers used in the risk map, what they represent and their weightings. The weighting assigned is based on the layers impact on the overall phosphorus loss risk.
| Input Layer | Represents | Represents |
| Catchment sensitivity – P risk | The sensitivity to the receiving environment to phosphorus. This was provided by the Regional Council. | 25% |
| Sediment risk | Phosphorus is bound to sediment. Any sediment loss increases the risk of phosphorus loss. This layer is from the sediment risk map. | 24% |
| Smap P retention / FSL P retention | The ability of the soil to hold on to phosphorus. The higher this value, the more likely phosphorus will be lost. | 17% |
| Acid soluble P | The phosphorus contained in the soil. The higher the acid soluble P, the more likely phosphorus will be lost. | 11% |
| Slope (10 m pixels – in degrees) | The risk of runoff. The steeper the slope, the higher the runoff risk. | 9% |
| Smap runoff potential / FSL soil drainage | The effect of soil type on phosphorus loss. Poor draining soils have a higher runoff potential. Note: If present, S-map data is used. Otherwise, the fundamental soil layer (FSL) is used. FSL data layer is coarser than S-maps. |
9% |
| Annual accumulated rainfall (mm) | Total average rainfall based on long-term data for the catchment. Higher rainfalls increase the phosphorus runoff risk. | 5% |
How to interpret
The example P risk map for an area of a farm is shown in the image below. It identifies the following:
- Low risk of P loss on the flats
- Higher risk on the steeper land
- Higher risk on the land adjacent to the stream (streambank erosion).
Some of these risk areas may have already been mitigated or managed to reduce P loss risk such as stock exclusion, fencing and riparian or poplar pole planting or use low solubility P fertiliser. Alternatively, the landowner could use this map to identify or prioritise areas for mitigation options.
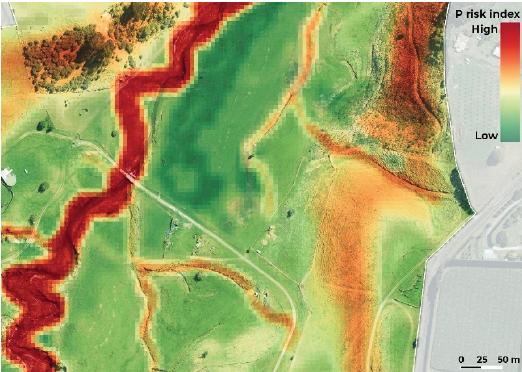
Example risk map for phosphorus.