Biophysical Risk Map – Sediment
Sediment risk processes
Sediment can enter waterwaysthrough multiple processes such as stream bank erosion, surficialerosion, runoff or overland flow and landslides. A landowner hascontrol over only some of these processes.
Sediment can enter waterwaysthrough soil erosion into the waterway (e.g. surficial andstream bank erosion) or indirectly through runoff (where sedimentis carried in surface water runoff) through overland flow pathways.
These are the processes a landowner can directly impact through land management and therefore were included in the sediment risk model table below.
Data layers used in the risk map, what they represent and their weightings
For sediment, a different approach was used to weight the layers. The maximum value from each of the three layers is taken and presented in the risk map.
| Input Layer | Represents | Excluded | Weighting |
| HEL Woody/HEL LCDB 2018 (HEL = Highly Erodible Land) |
|
|
Take the maximum value from the three input rasters. |
| Soil loss from surface erosion (Donovan 2022) |
Surface erosion, using these inputs:
|
|
|
| Streambank erosion risk buffer – stream order (Overland flow pathway with buffer) |
Streambank erosion |
|
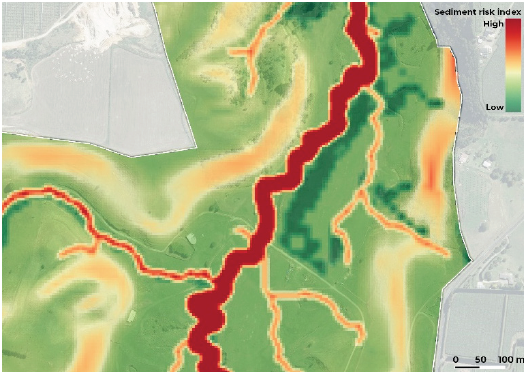
How to interpret
The example sediment risk map for a farm is shown below. It identifies the following risk areas:
- High risk areas are in land adjacent or within a stream channel due to stream bank erosion
- Moderate risk areas are on the sloped land from runoff risk
- Low risk areas are on the flatter country.
Some of these risk areas may have already been mitigated or managed to reduce sediment loss risk such as stock exclusion, fencing and riparian or poplar pole planting and use of grassy buffer zones. Alternatively, the landowner could use this map to identify or prioritise areas for mitigation options.