

Maritime Asset Management Plan
Below is a summary of the Maritime Asset Management Plan (AMP).
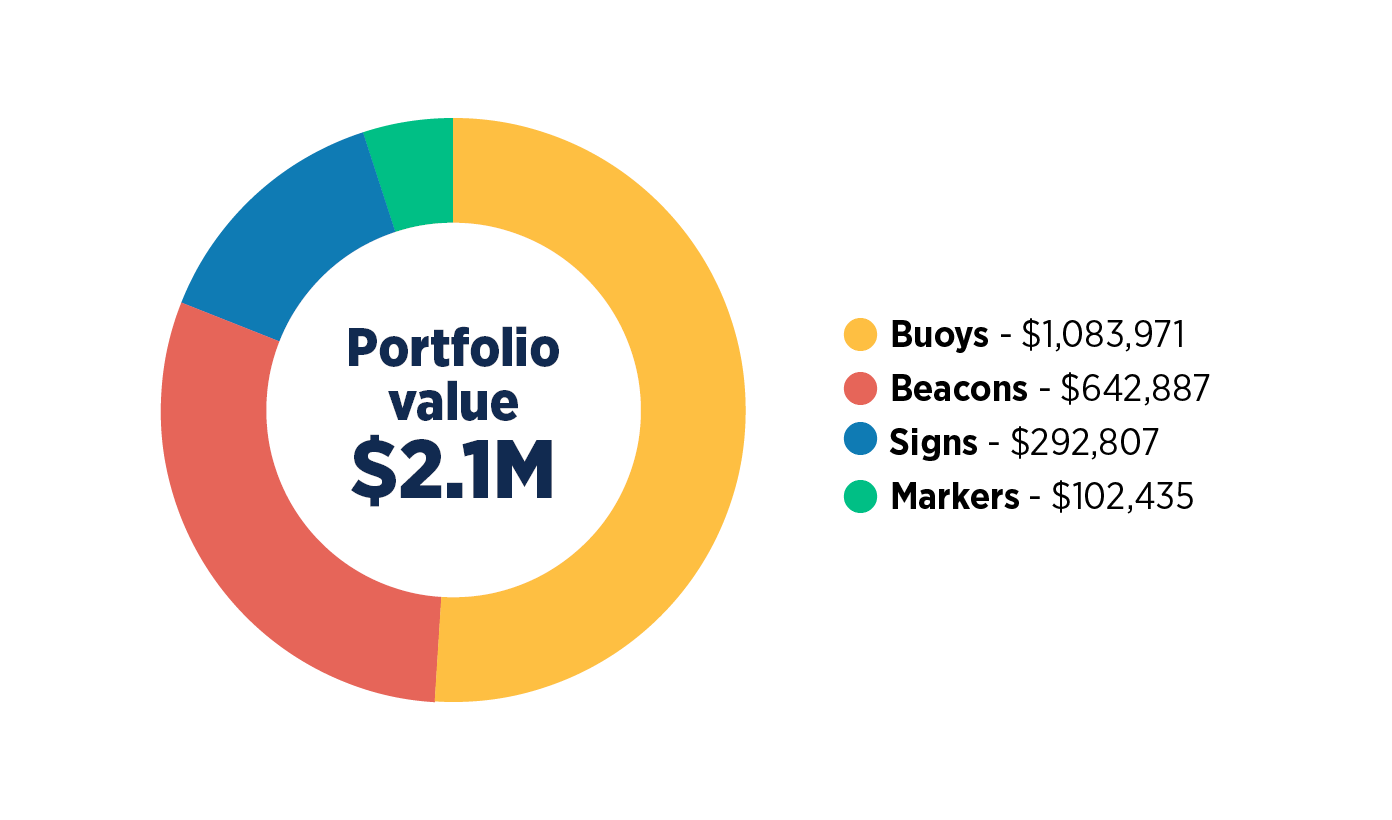
It outlines a 10-year strategy for how we manage and maintain the assets and services that contribute to this activity, which are collectively valued at about $2.1M (as of 30 June, 2024).
Activity and Asset Overview (Part 3)
We are mandated to ensure 24/7 maritime oil response and navigation safety in the navigable waters within our authority. This area includes the coastal areas up to 12 nautical miles out to sea, as well as the navigable waters of rivers, harbours, estuaries and lakes.
Within these navigable waters, we are the statutory and regulatory harbour authority, with responsibility for navigation safety managed by the Harbourmaster and maritime team.
We currently manage and maintain approximately $2.1M worth of maritime assets. This includes 891 navigational assets located within the navigable waters of the region. There are four key asset types: beacons, buoys, markers and signs.
A summary of the asset portfolio is as follows:
Asset Condition (Part 3, Section 4)
Keeping navigational aids operating is an important task, and the maritime team use best practice by following the Maritime New Zealand Aids to Navigation Guidelines.
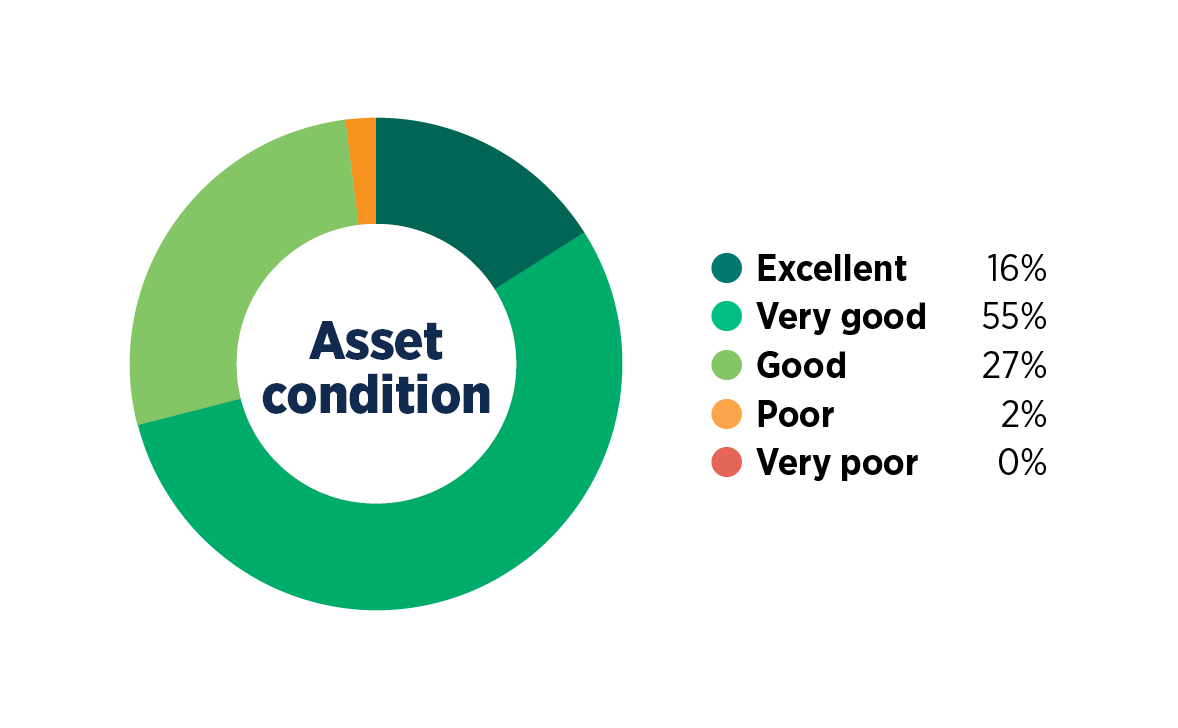
The condition of our assets is assessed on a six-monthly rotation where they are assigned a rating from 1 to 5 (1 is an asset that is in excellent condition and 5 is very poor condition). Assets in poor to very poor condition are prioritised for renewal.
Below is the overall asset condition for Maritime asset portfolio (2021 data).
Levels of Service (LoS) (Part 4)
LoS are performance goals for the Regional Council for a particular activity. These are agreed on with the community through the Long Term Plan consultation process and are aligned to the community outcomes. They also provide the basis for lifecycle management strategies and work programmes for staff to make sure the LoS are achieved.
The maritime activity has one asset-specific LoS statement (which is represented in Regional Council’s 2024-34 LTP): ‘Signage and navigational aids are installed and maintained to enable efficient and safe access’. The performance target for this LoS measure is to have 95% of navigation aids rated as being ‘Good’ condition or higher. This target is currently being met.
Another asset specific LoS, which is not included in Regional Council’s LTP, is related to the condition of onshore signs. The set target for this LoS is 90% and is also currently being achieved.
Future Demand Drivers and Management (Part 5)
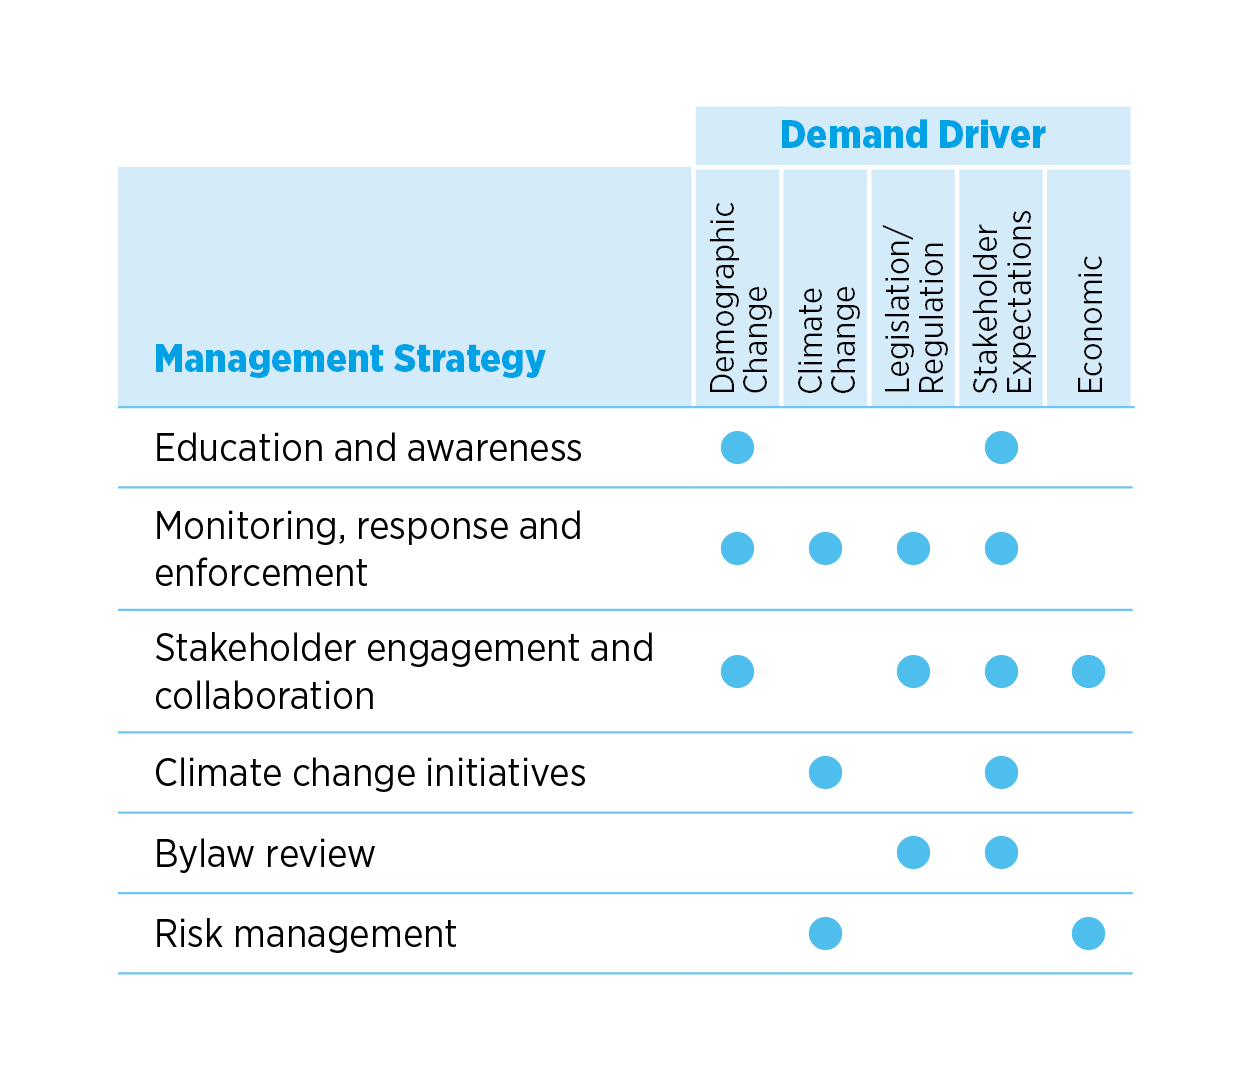
Continuous improvement and future planning are a critical part of asset management. For this activity, we have identified five future demand drivers: Demographic change, climate change and sustainability, legislative / regulatory requirements, economic and stakeholder expectations.
In the AMP, we assess how these demand drivers may impact our assets and services, and put management strategies in place to ensure we can adapt to meet the current and future demands of the community. This way we can optimise our current assets and resources, improve our ways of working, and adapt to a changing climate.
The table below demonstrates what management strategies are planned for this activity to meet the needs of future demand drivers.
Lifecycle Management (Part 6)
Lifecycle management determines the best operational and capital investment to deliver LoS, and uses this as a basis for long-term financial forecasts for the Long Term Plan.
The activity’s lifecycle management programme covers the three categories that are necessary to manage an asset over its whole life and deliver required levels of service. These are operations and maintenance (on-going work required to keep assets going), renewals (major works that restores, rehabilitates, replaces or renews an existing asset to like-new condition), and new capital works (creating new assets).
Risk Management (Part 7)
The risk management process for the activity includes identifying, assessing, evaluating, treating, and continually monitoring key risks.
Three key risks identified include:
- The occurrence of an incident, accident or emergency.
- Changes in traffic volumes and/or patterns.
- Other decisions, changes, or modifications to Regional Council and/or Maritime Operations.
Financial Planning (Part 8)
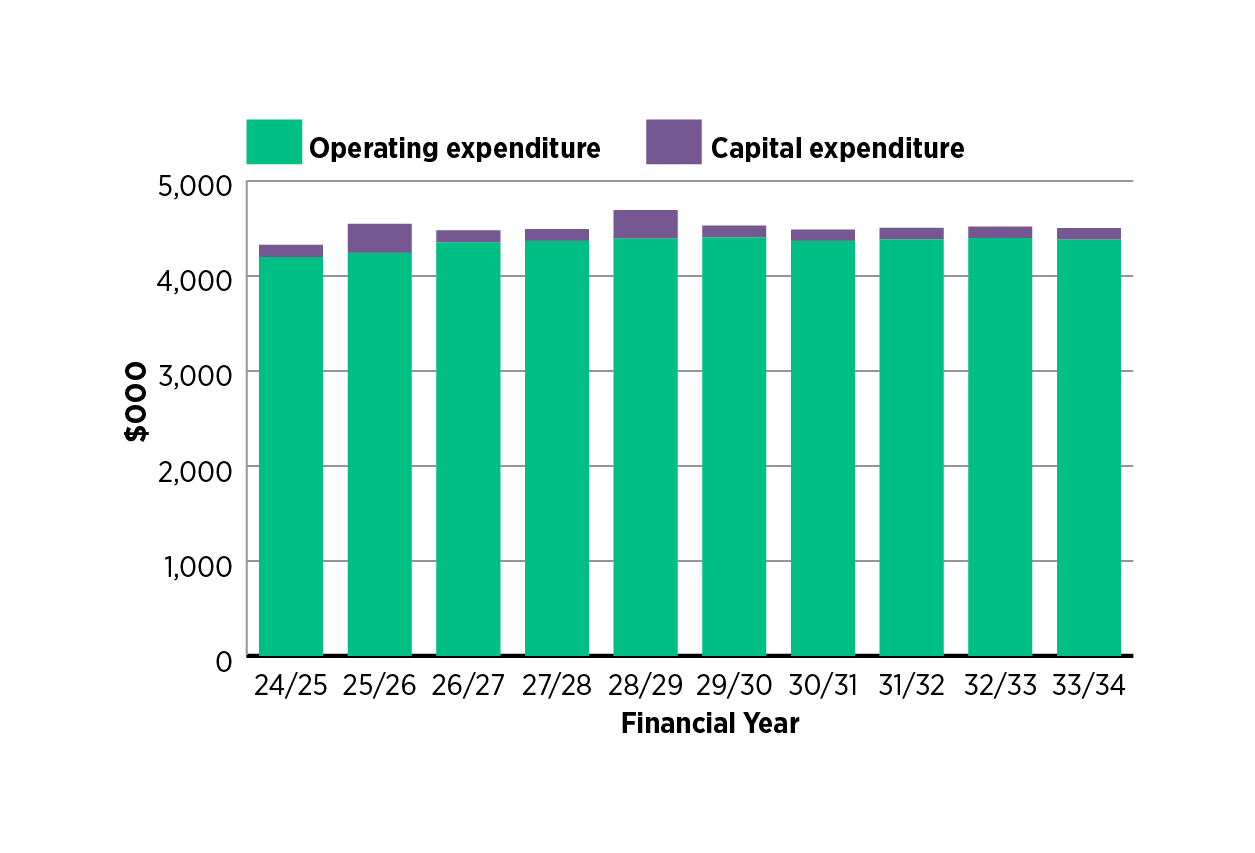
The below graph highlights the forecast financial projections for the planned operational (operation and maintenance) and capital expenditure (renewal and new) for maritime assets. The target is to retain relatively stable levels of operating expenditures for all asset types. Funding for operational activities comes entirely from general funds.
Capital expenditure for new assets is typically not covered by rates but is instead spread over time using reserves and/ or borrowing, with net operating surpluses contributing to specific asset replacement reserves.
Improvement Plan (Part 9, section 9.2)
A central theme to all our AMPs is continuous improvement. Eight improvement items have been identified and compiled into a plan for the next three years. Key priorities include developing a maintenance plan for all assets to capture activities, frequencies and costs; risk assessments for geographical zones and improve demand impact analysis by collecting further data.